Rapid and repeatable geospatial analysis with Python and JavaScript using notebooks
Hey FOSS4G North America Folks,
I gave a talk at FOSS4G NA 2019 called Rapid and repeatable geospatial analysis with Python and JavaScript using notebooks. This page contains information about the slides, links to tools and resources I mentioned in my talk. If you'd like to start a conversation with me or keep up with my work, you can find details on me at the bottom of this page.Example Notebook Structure
- Title
- Short explanation why you‘re doing it.
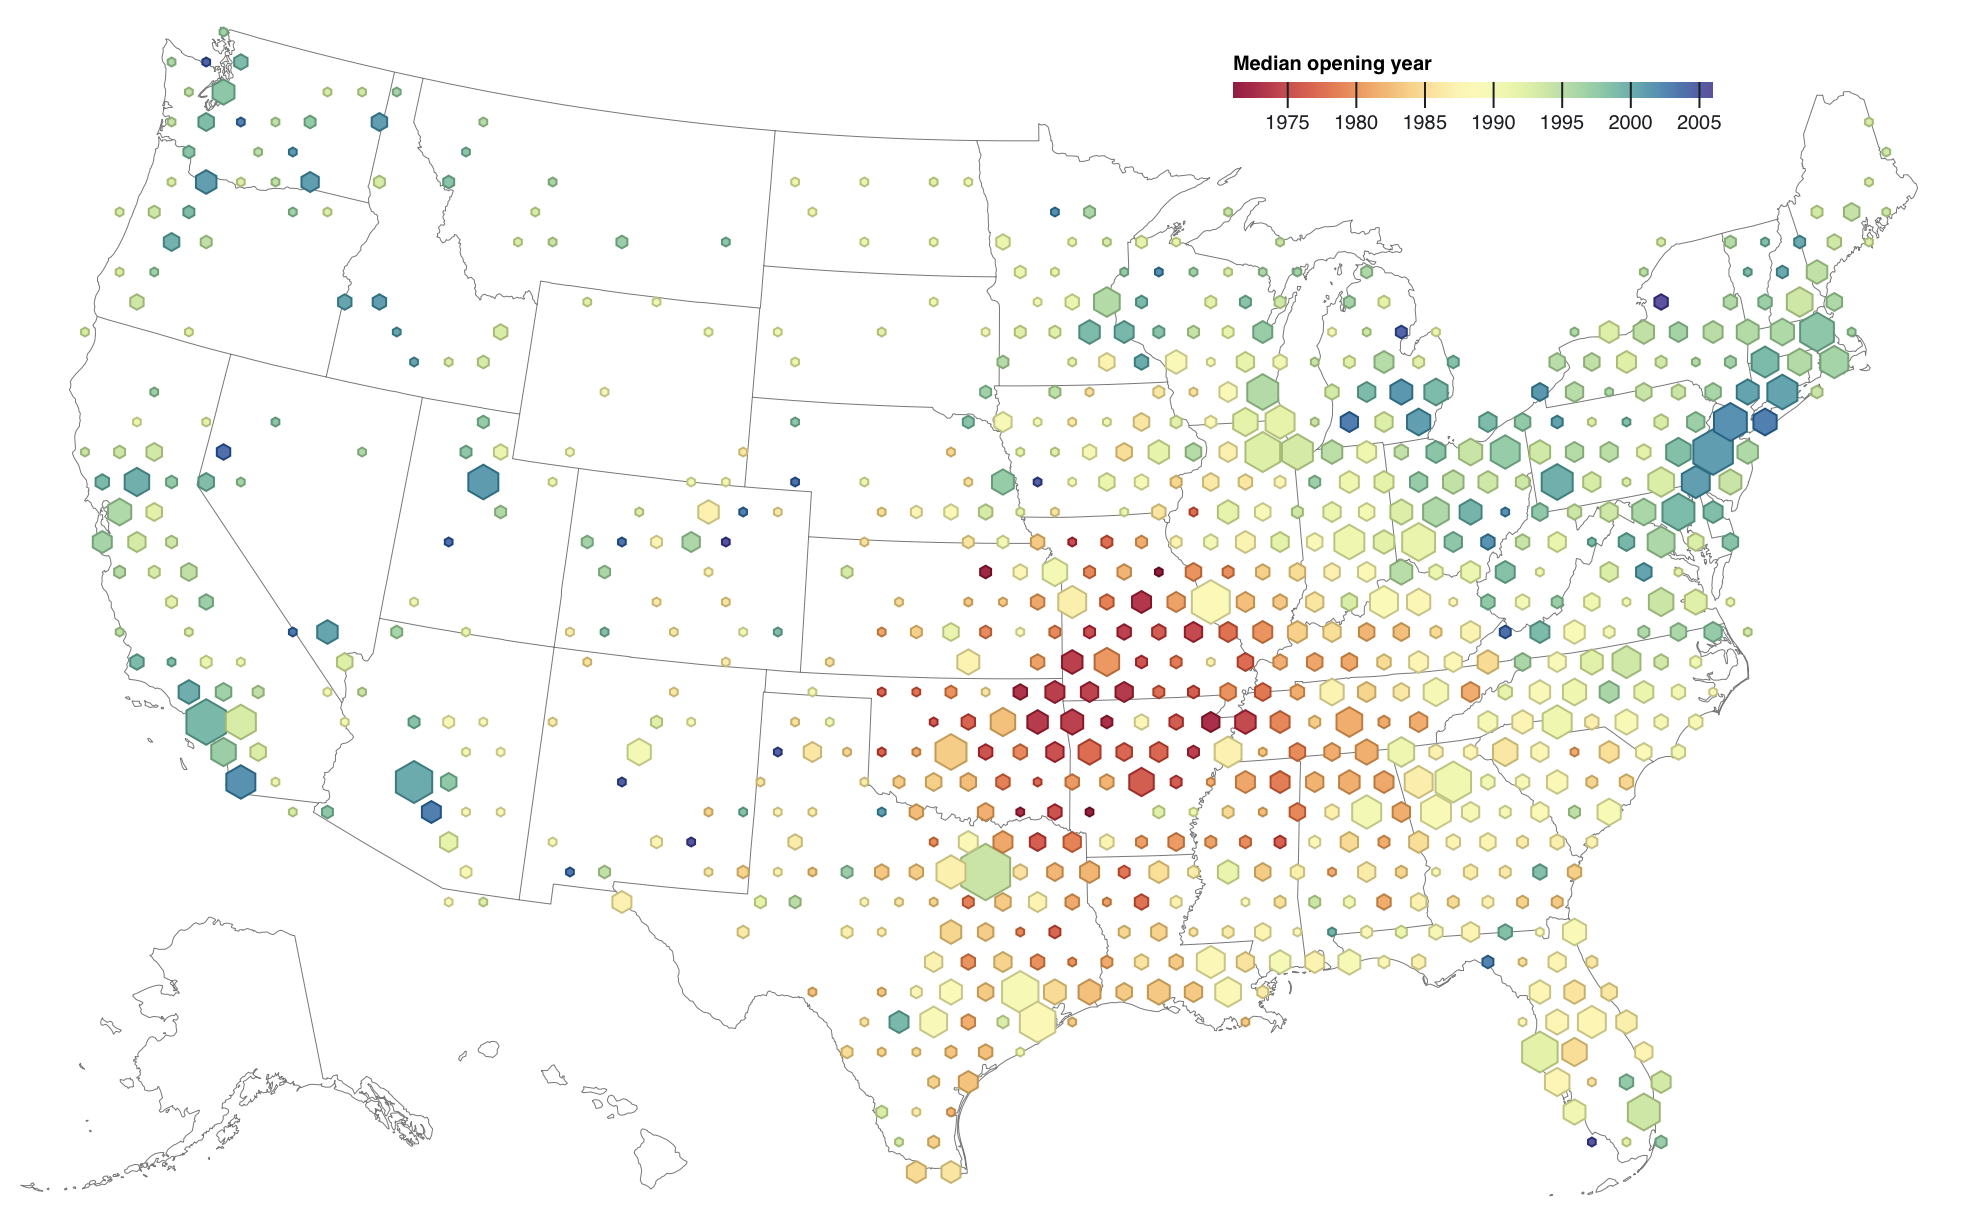
- Result (Visualization, Conclusion)
- Steps to create with explanations in between (make good use of the markdown you‘re able to write)
- Data Including Data Sources Explanations
- Libraries
- Date of the creation/update
Geospatial Data Visualization with d3 - Online Workshop
If you're interested in learning more about observable and how to create data visualizations with d3, check out my new online course:
Check it out
About me
I help civic advocacy groups and governments improve the life of citizens with the help of Open Data.
I run an Open Data Consultancy called Civic Vision who helps civic advocacy groups and governments use the power of Open Data and Open Source to build Visualizations, Data Stories and Tools to increase transparency and accountability.
Follow me on twitter @milafrerichs